

- A dashboard is an overview for monitoring the current state, so do not include a detail the reader does not need to monitor.
- Put the most important information where the reader's eye starts, accent key figures with size, and avoid 3D charts and variety for its own sake.
- Do not rely on colour alone to convey meaning, and keep text contrast at 4.5:1 or higher so the dashboard is readable for everyone.
Why do so many dashboards fail?
Management asks for a dashboard, so the team puts all the available data on one page: dozens of charts in different colours, six-digit numbers and 3D visuals. The dashboard looks rich, but the director closes it after a minute and asks for a summary by email.
The problem is not the tool but the question: what decision is this dashboard meant to support? Microsoft sums it up by describing a dashboard as an overview, a single place to monitor the current state of the data, and advising that you should not put a detail on it unless readers need to monitor it. [1]
- 1Know the audienceWho reads it, on what device?
- 2Define decisionsWhat do they monitor and decide?
- 3Choose indicatorsOnly the essential few
- 4Order and formatMost important first and largest
- 5TestWith users and for accessibility
Start with the audience and the device
A chief executive’s dashboard differs from an operations manager’s. The first needs a few strategic indicators compared with targets; the second needs daily detail to act on.
Think about the device too: Microsoft advises that a dashboard read on a tablet or phone is more readable with fewer tiles. [1] Many leaders check indicators on their phones between meetings.
Tell the story on one screen
Because dashboards are meant to show important information at a glance, Microsoft says it is best to have all tiles on one screen, asks whether you can avoid scroll bars, and recommends removing all but essential information. [1] When presenting in meetings, use full-screen mode without distractions. [1]
Order by importance and accent with size
Microsoft recommends putting the highest level of data in the top corner, following the audience’s reading direction, then showing more detail as you move across. [1] The original guidance is written for left-to-right readers, so it starts at the top left; on an Arabic dashboard read from the right, the logical place for the key indicator is the top right.
If text and visuals are all the same size, readers find it hard to focus on what matters most. Use card visuals for key numbers and give every number context. [1] “85%” on its own means little; “85% against a 90% target” tells the director where things stand.
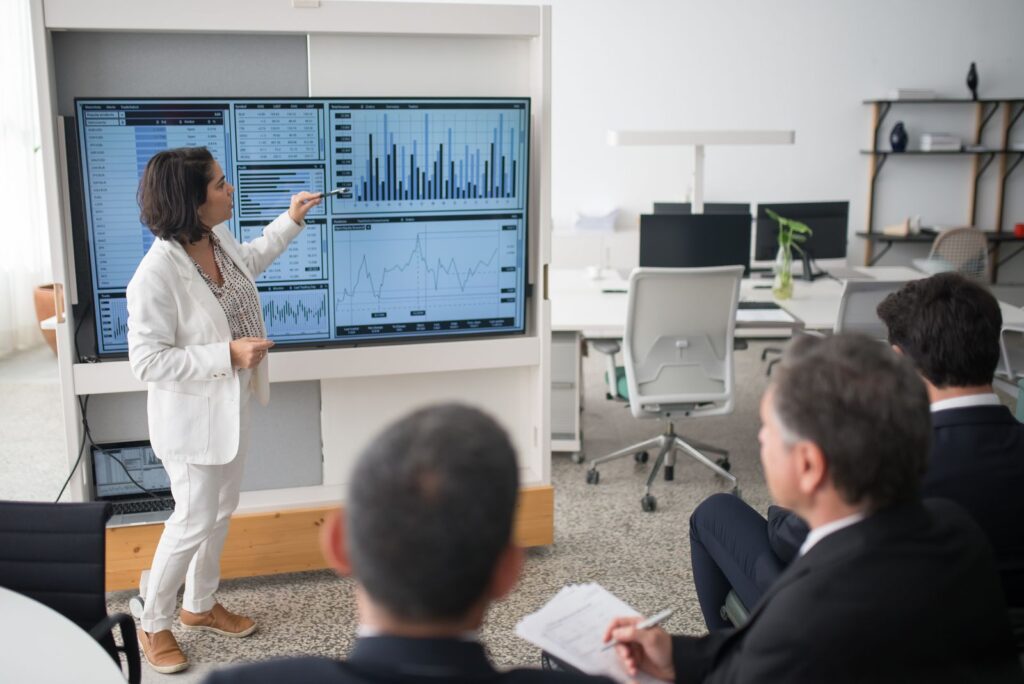
Choose the chart that fits the question
| Question | Suitable chart | Note |
|---|---|---|
| What is the key number now? | Card | With context such as target or prior period |
| Which is largest? | Bar or column | Sort by value to highlight the top |
| How has it changed over time? | Line | With markers for each series |
| Where are we against target? | Gauge | Current status versus goal |
| What share is each part? | Pie | Fewer than eight categories only |
Microsoft advises avoiding hard-to-read visuals such as 3D charts, and avoiding variety for the sake of variety. It considers pie, donut and gauge charts generally less than ideal: bars and columns are better for comparing values because people can compare them side by side, pie charts work best with fewer than eight categories and for part-to-whole relationships, and gauges are useful for showing current status against a goal. [1]
Format numbers and keep scales consistent
Long numbers are one of the biggest sources of confusion. Microsoft recommends showing no more than three or four numerals, with one or two to the left of the decimal point, scaled to thousands or millions; “3.4 million” is easier to read than “3,400,000”. [1]
Other important points: [1]
- Keep axis scales and category order consistent across charts.
- Do not mix large and small measures on the same scale.
- Do not mix levels of precision and time periods on one dashboard.
- Remove unnecessary data labels; readers can usually understand bar values without the number shown.
- Sort by value to highlight the highest or lowest, and by axis when readers need to find a particular category quickly.
Make the dashboard readable for everyone
Accessibility is not optional, especially in government. Microsoft’s accessibility guidance includes: [2]
- Do not rely on colour alone to convey information; add different marker shapes for each series in line charts.
- Contrast: a contrast ratio of at least 4.5:1 between text and background, in line with WCAG 2.1.
- Colour vision deficiency: use fewer colours and avoid combinations such as red and green or blue and purple.
- Alt text: describe the insight the visual gives, not its title or type, within 250 characters.
- Tooltips: do not put important information in them, because screen readers cannot read them.
- Titles: avoid unclear abbreviations; “Current Year Sales Amount USD Totals” is clearer than “CY Totals”.

A hypothetical example: a director general’s dashboard
A director general at a service entity asks for a performance dashboard. The first version has 22 charts across three screens. The team redesigns it by asking which decisions the director makes each month, and finds three: allocating staff between branches, monitoring compliance with service times, and tracking spending against budget.
The dashboard becomes a single screen: three cards at the top right (service-time compliance, budget spent and customer satisfaction), each with its target, then sorted columns for branch performance and a line for the monthly trend. Everything else stays in a separate report opened when needed. The case is hypothetical, to illustrate the method.
Common mistakes in management dashboards
- Starting with the data available rather than the decisions needed.
- Showing numbers with no target or comparison period.
- Using many colours without meaning, or red and green alone to show status.
- Launching without testing it with real users; Microsoft recommends showing the report to its consumers early and collecting feedback. [2]
Conclusion
A good dashboard answers management’s question in seconds: start with the decision and the audience, show the essential few on one screen, put the most important item where the eye starts, choose the chart to fit the question, format numbers, and make it readable for everyone.
Frequently asked questions
What is the difference between a dashboard and a report in Power BI?
A dashboard in the Power BI service is a single page of tiles pinned from one or more reports for monitoring at a glance, while a report can have multiple pages for analysis and drilling down. [1]
Is a pie chart always a bad choice?
Not always. Microsoft says pie charts work best with fewer than eight categories and for showing part-to-whole relationships rather than comparing the parts; for comparison, bars and columns are clearer. [1]
How many indicators should a senior management dashboard have?
There is no fixed number, but the aim is for all tiles to fit on one screen without scrolling and for everything that is not essential to monitoring to be removed. [1]
How do I make a dashboard work for people with colour vision deficiency?
Use fewer colours, add different marker shapes for each series, avoid combinations such as red and green, and test the design with colour-blindness simulators. [2]
References
- Microsoft Learn. Tips for designing a great Power BI dashboard
- Microsoft Learn. Design Power BI reports for accessibility
Recommended programmes