- A good crowd management plan covers ingress, circulation and egress, in normal and emergency conditions, from the angles of design, information and management.
- Safe capacity is calculated from both space and exits, and density and flow rates are indicators to monitor live, not estimate once.
- Analysis of the 2006 Mina disaster showed that stop-and-go movement preceded the disaster by more than half an hour, making it a detectable early warning signal.
This article is for professional awareness; crowd plans must be prepared and approved in line with the requirements of civil defence and the event permitting authorities in each country.
Why do crowd incidents happen?
Crowd incidents rarely have a single cause. The UK Health and Safety Executive’s guidance lists hazards arising from crowd dynamics, such as surging and swaying that squeeze people together or against fixed structures, and falls and trampling; and hazards arising from the venue, such as too few or unsuitable exits, layouts that cause crossflow, turnstile failures, and stalls that cause congestion at busy times. [1]
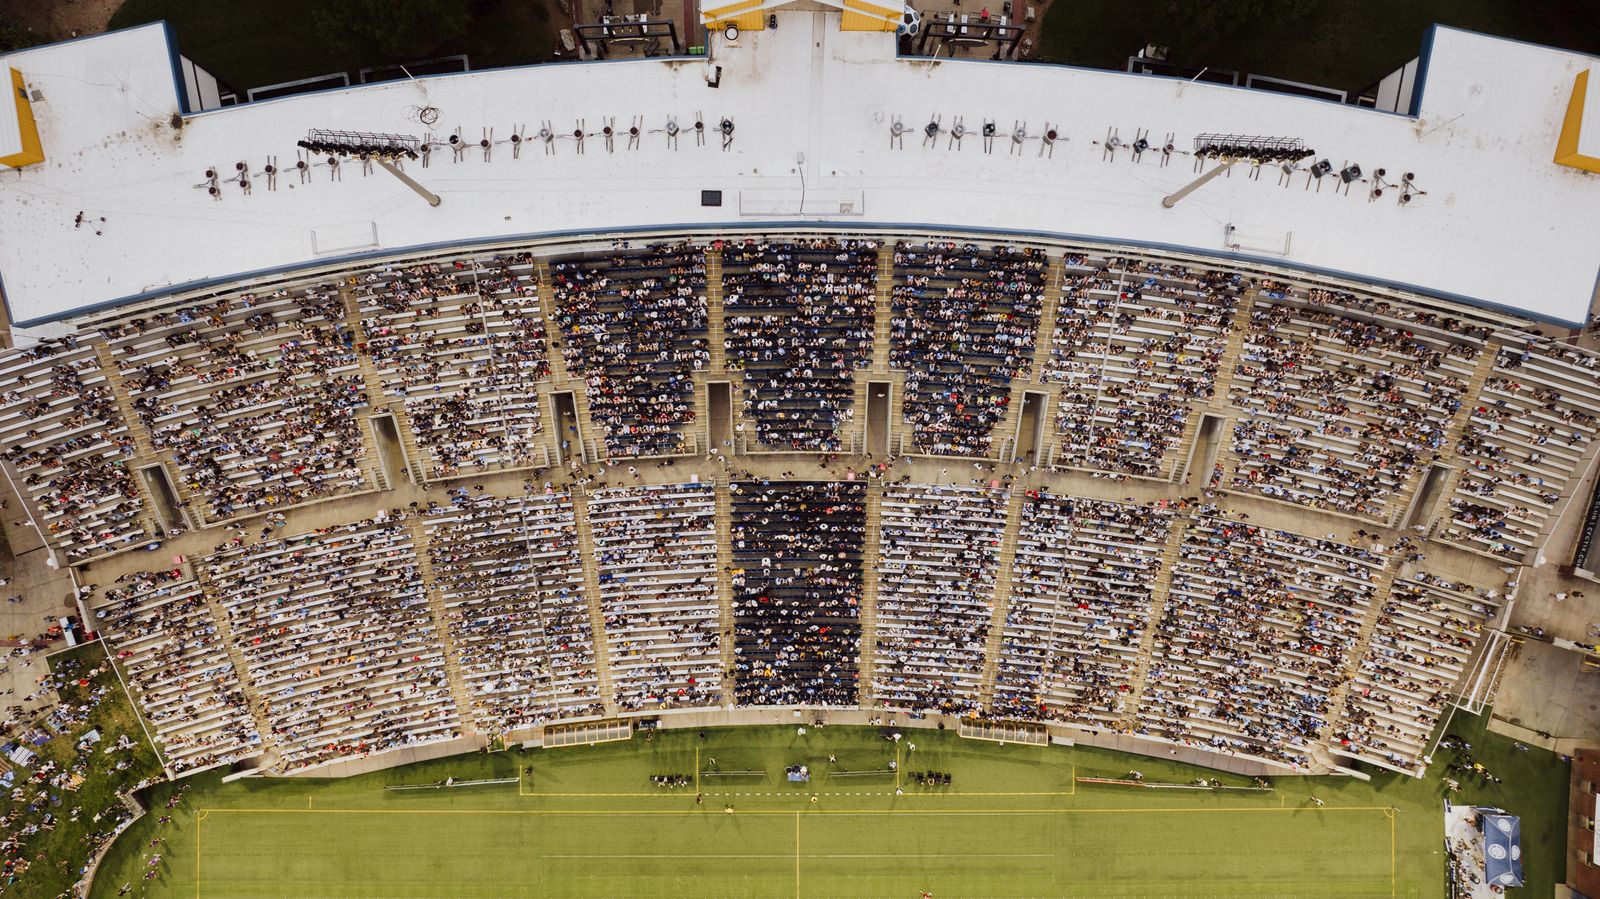
Density is the most dangerous of these factors. Keith Still, a professor of crowd science, notes that event safety limits are typically assessed at 2 people per square metre, that the UK Green Guide uses 4.7 people per square metre for standing viewing areas, and that 5 people per square metre should be the upper limit for such areas. [4]
How do you build a crowd plan? The DIM-ICE model
The DIM-ICE model breaks an event into three phases: ingress, circulation and egress. It examines each phase from three angles: design, meaning capacity and throughput limits; information reaching the crowd through signage, announcements and social media; and management, meaning the procedures used to run the event. Each cell is reviewed in two modes: normal and emergency. [5]
| Phase | Design | Information | Management |
|---|---|---|---|
| Ingress | Number and width of gates | Door-opening time, route signage | Queue and search management |
| Circulation | Routes without crossflow | Maps and PA announcements | Pinch-point monitoring |
| Egress | Exit capacity | Phased exit instructions | Opening exits, directing flow |
Each cell is then colour-coded by risk: red needs improvement, orange needs monitoring and green is done well. The completed matrix becomes a checklist that proves the plan leaves no phase or angle unaddressed. [5] The model also reminds planners that crowd mood is shaped by the event, its environment and the crowd itself, and that the event organiser and crowd manager control the design and information influences, so start with those when dealing with the red cells. [5]
Planning: safe capacity and exits
HSE guidance starts by setting safe capacity from a venue assessment, so that the site allows safe assembly, entry, movement, exit and rapid evacuation, and outdoor sites can be split into zones such as arrival and exit, viewing, attractions and stages. It recommends visiting the site to anticipate crowd behaviour, such as illegal parking blocking emergency vehicles or people gathering in prohibited areas. [1]
Space alone does not set capacity; exits do too. In calculating exit and emergency exit capacity, the Green Guide for sports grounds uses a rate of 82 people per metre width per minute on a level surface and 66 on a stepped surface, noting that designing a level route for fewer than 82 gives more comfortable circulation. [3]
Hypothetical example: a standing area in front of a stage
Hypothetical example: a level standing area with a net area of 3,000 square metres and exits with a combined width of 8 metres.
| Step | Calculation | Result |
|---|---|---|
| Capacity by area | 3,000 × 2 people/m² | 6,000 people |
| Exit capacity | 8 m × 82 people/m/min | 656 people per minute |
| Egress time | 6,000 ÷ 656 | about 9 minutes |
If the egress time allowed by the relevant authority is shorter than this, safe capacity is not 6,000: either reduce numbers or widen the exits. The figures here are illustrative inputs; what counts is what the competent authority in your country approves.
Know your audience before it arrives
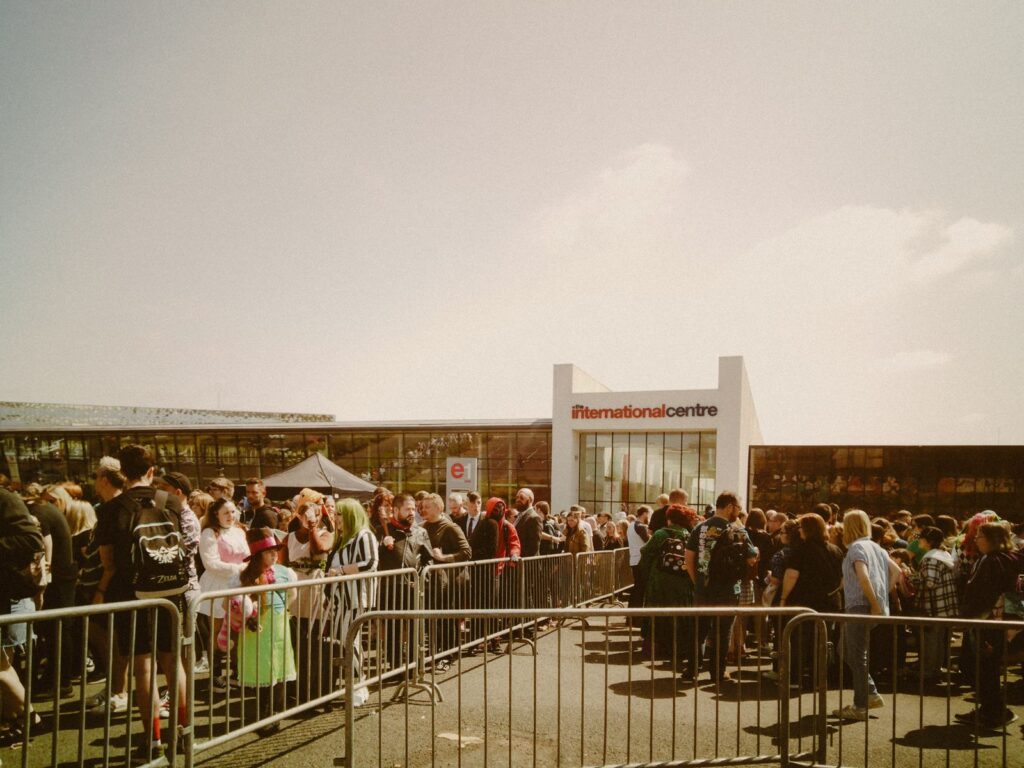
HSE recommends forecasting attendance from past and similar events, registrations and ticket sales, taking account of weather, transport and public holidays. It notes that the type of performance and the age range a performer attracts help predict behaviour, that visitors who arrive in daylight and leave after dark may become disoriented, and that poor queue management can cause surges when doors open or lead people to climb over barriers. [1]
The guidance also notes that multiple acts or devoted fans can cause considerable movement and sudden forward surges, and that smoke or haze effects may slow the response to a real fire. For arrival and departure, it highlights friends and family waiting at entrances and exits and blocking them, stalls congesting exits, and adequate lighting on routes after dark. [1]
It also asks planners to consider young people and people with disabilities or learning difficulties. [1] At major religious and national events in the Gulf, further factors may include many languages, elderly visitors and people arriving in simultaneous waves.
Monitoring: from estimates to numbers
HSE guidance sets out what to monitor: total numbers against safe capacity, local density and distribution, flow rates into and out of areas, and crowd behaviour, including surging, pushing and tension in the atmosphere. It also sets out where: entrances and exits, standing areas prone to surges, stairs and pinch-points, and queues and confined spaces. [2]
- Numbers against safe capacity
- Local density and distribution
- Flow rates in and out
- Stop-and-go movement or swaying
- Entrances and exits
- Stairs and pinch-points
- Queues and confined spaces
- Standing areas in front of stages
- Counters, turnstiles, digital tickets
- CCTV and viewing platforms
- Staff within the crowd
- Social media monitoring
Tools include hand counters, turnstiles, chipped tickets or wristbands, people-counting sensors and mobile phone signals, alongside CCTV, viewing platforms, drones, social media, and staff patrolling within the crowd to observe faces and spot signs of distress. [2] Still cautions that density can look higher than it is when the camera angle is low. [4]

Early warning signs: lessons from Hajj
Dirk Helbing, Anders Johansson and Habib Zein Al-Abideen analysed video footage of the Mina disaster during the 1426H Hajj (12 January 2006). The analysis showed two sudden transitions: from smooth flow to stop-and-go waves, then to turbulent movement resembling earthquakes, producing sudden surges that can knock people over. [6]
The timeline is the key lesson: stop-and-go waves appeared at about 11:53 and lasted more than 20 minutes, turbulence began at about 12:19, and the accident began about 10 minutes later. Stop-and-go waves began when outflow dropped below 0.8 people per metre per second, and the researchers suggest detecting them through video analysis as a warning signal. [6]
The study defined “crowd pressure” as local density multiplied by the variance of velocities, calling it the decisive measure for identifying critical places and times. It also found that local densities exceeded 10 people per square metre while the average rarely exceeded 6. [6] In other words, the overall average can reassure a control room while danger builds in a single spot.
Response: decisions agreed in advance
Effective response is not improvised. HSE guidance calls for catching problems early and reacting, having staff on the ground to help people and defuse situations, and considering extra staff at busy times. [2] It helps if the plan sets, for each indicator, a trigger, an action and an owner:
- A clear trigger: for example, numbers approaching safe capacity, or stop-and-go movement at an exit.
- A ready action: pausing entry, opening additional exits or diverting a route.
- A prepared message: PA announcements, signs and social media posts, because information is one of the levers for controlling a crowd. [5]
- A named decision-maker: by name and authority, with a deputy.
After the 2006 disaster, changes of this kind were applied for the 1427H Hajj: automated pilgrim counting from cameras, one-way operation of streets and plazas to reduce counterflows, scheduling and routing to spread pilgrims in space and time, and an elongated, elliptical shape for the Jamarat to raise stoning capacity. [6] HSE also recommends reviewing plans periodically and treats a post-event debrief as good practice, especially after significant incidents or changes to the venue or procedures. [1]
Conclusion
Crowd management starts with a plan that covers ingress, circulation and egress in both normal and emergency modes, with capacity calculated from space and exits together. Then comes monitoring by numbers and response through decisions agreed in advance, because early warning signs usually appear well before a disaster for anyone who is watching.
Frequently asked questions
What crowd density is dangerous?
Crowd scientist Keith Still notes that event safety limits are typically assessed at 2 people per square metre, and that 5 people per square metre should be the upper limit for standing and viewing areas. [4]
How do I calculate the time for an audience to leave an area?
Divide the number of people by the exit capacity, where exit capacity is the width in metres multiplied by the flow rate. The UK Green Guide uses 82 people per metre width per minute on a level surface and 66 on a stepped surface. [3]
What matters most to monitor during an event?
Numbers against safe capacity, density and its distribution, flow rates into and out of areas, and crowd behaviour such as pushing and tension, especially at entrances, pinch-points and queues. [2]
Can a crush be predicted before it happens?
Video analysis of the 2006 Mina disaster showed stop-and-go waves appeared about 26 minutes before turbulent movement began, and the researchers propose using them as a warning signal that video analysis can detect. [6]
Who decides to stop entry or change routes?
The plan should set this in advance by name and authority, with a deputy. HSE guidance makes early detection of and reaction to overcrowding the purpose of monitoring, and notes that staff observations feed supervisors and key decision-makers, which only works if everyone knows who those are. [2]
References
- Health and Safety Executive (HSE). Assess crowd safety risks and identify hazards
- Health and Safety Executive (HSE). Monitor the crowd
- Sports Grounds Safety Authority (SGSA). Egress (Green Guide: physical factors, circulation)
- G. Keith Still. Static crowd density (general)
- G. Keith Still. Developing a safe, robust crowd management plan (DIM-ICE)
- Physical Review E (Helbing, Johansson, Al-Abideen). The Dynamics of Crowd Disasters: An Empirical Study (2007)